Have you ever had a dataset with start and end times for events where you wanted to know how many events were occuring simultaneously a given timestamp?
This has come up many times for me, both in my professional work as well as in questions on the R4DS slack community, where I am a mentor. I would guess that this is a common data wrangling problem for anyone working with this type of data.
Motivating Example
Let’s create a toy dataset of login and logout times, where we want to know how many users were logged in simultaneously during a given minute.
library(tidyverse)
library(lubridate)
source(here::here("imports.R"))

starting_times <- seq(from = as_datetime("2021-01-01 00:00:00"),
                      to = as_datetime("2021-01-10 00:00:00"), by = "hour")

ending_times <- seq(from = as_datetime("2021-01-10 00:00:00"),
                    to = as_datetime("2021-01-20 00:00:00"), by = "hour")

event_data <- tibble(event_num = paste0("session_", seq(1, 100, by = 1)),
                     login = sample(starting_times, 100), logout =  sample(ending_times, 100))
Generate Datetime Sequence
Now I’ll generate a datetime sequence for each login and logout event. The most straightforward way to do this is to map through each start and end time with the seq function.
Expand
The next step is to expand or unnest these datetime sequences into a long format.
event_data_expanded <- event_data_seq %>%
  unnest(dt_sequences) %>%
  rename(dt = dt_sequences) %>%
  select(event_num, dt)

event_data_expanded
# A tibble: 22,403 x 2
   event_num dt
   <chr>     <dttm>
 1 session_1 2021-01-05 21:00:00
 2 session_1 2021-01-05 22:00:00
 3 session_1 2021-01-05 23:00:00
 4 session_1 2021-01-06 00:00:00
 5 session_1 2021-01-06 01:00:00
 6 session_1 2021-01-06 02:00:00
 7 session_1 2021-01-06 03:00:00
 8 session_1 2021-01-06 04:00:00
 9 session_1 2021-01-06 05:00:00
10 session_1 2021-01-06 06:00:00
# … with 22,393 more rows
Great! Now the dt column has all the minutes that each session was active expanded in a tidy format.
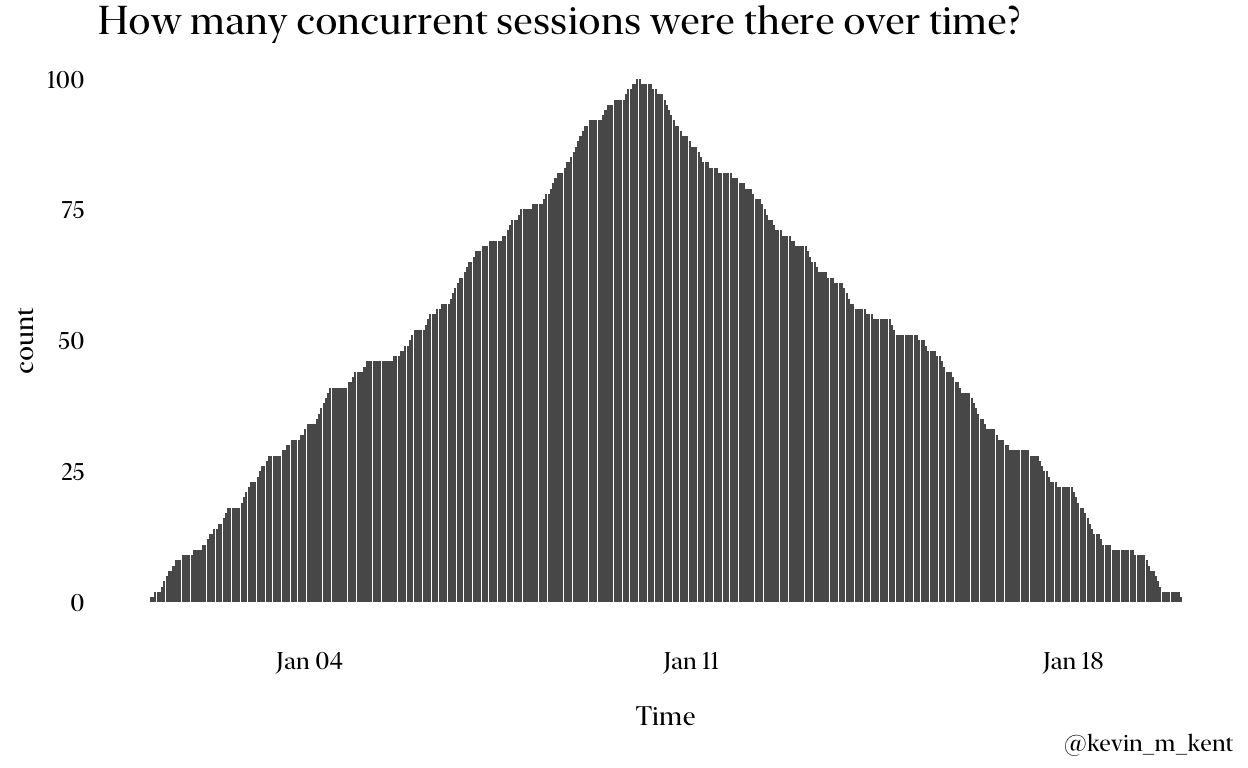
Visualize
Let’s see how many concurrent sessions there were over time.
event_data_expanded %>%
  count(dt) %>%
  ggplot(aes(dt, n)) +
    geom_col() + labs(title = "How many concurrent sessions were there over time?",
                      x = "Time", y = "count",
                      caption = "@kevin_m_kent") + theme_me()
That’s it! I’d love to hear what you think and if you have another way of solving this problem.